

Air Blower P-Q Curve: Comprehensive Guide for Real-World System Selection
Master performance matching, static pressure evaluations, and dynamic resistance calculations using the technical TKFAN air blower P-Q curve.
Why Selecting an Air Blower Without a P-Q Curve Leads to System Failure
Original Equipment Manufacturer (OEM) hardware engineers, mechanical designers, and system architects frequently make an expensive mistake during procurement: selecting a commercial air blower strictly based on the "free-air airflow" rating listed on a standard datasheet. Free-air airflow reflects maximum volumetric performance evaluated under ideal laboratory environments featuring zero static restriction. However, real-world engineering systems never operate under zero-resistance conditions.
In actual applications, air paths are restricted by HEPA filters, tight internal enclosures, narrow ductwork, heat sink fins, 90-degree elbows, and protective grilles. This internal friction introduces structural impedance, causing static pressure to rise and actual output airflow to drop significantly below nominal zero-static specs. Relying on baseline ratings rather than studying a dynamic air blower P-Q curve inevitably leads to thermal throttling, insufficient pneumatic delivery in medical devices, sensor cleaning failures in automotive ADAS arrays, excessive acoustic noise, and premature bearing wear.
To eliminate these integration bottlenecks, engineering teams must evaluate an official air blower P-Q curve—also identified as the pressure vs. discharge airflow curve. Comprehensive technical datasheets provided for every certified TKFAN air blower include a precise, laboratory-validated TKFAN air blower P-Q curve. Whether you are integrating micro blowers, high-pressure CPAP modules, 12V/24V/48V BLDC blowers, or industrial IP-rated fans, evaluating full-spectrum performance curves remains mandatory for long-term operational reliability.
Key Engineering Takeaways for Blower Selection
- Free-Air CFM is a Myth: Free-air flow only occurs at 0 Pa static pressure. Equipment enclosures always shift real performance leftward along the curve.
- Centrifugal vs. Axial: Centrifugal blowers maintain stable non-stall performance at high static pressures, whereas axial fans experience aerodynamic stall.
- The Operating Point: Real-world performance exists exclusively where the system impedance curve intersects the TKFAN air blower P-Q curve.
Deconstructing the Air Blower P-Q Curve: Essential Engineering Terminology
An air blower P-Q curve is a two-dimensional graph mapping the performance relationship between static pressure (P) and volumetric airflow rate (Q) at a fixed operating voltage, constant impeller speed, and standardized ambient air density (1.2 kg/m³).
| Axis / Parameter | Primary Metrics & Units | Engineering Physical Definition |
|---|---|---|
| Vertical Axis (Y-Axis) | Pascals (Pa), mmH₂O, InH₂O | Static Pressure (P): Represents the potential force the air blower exerts to push air past resistive elements inside the enclosure. |
| Horizontal Axis (X-Axis) | CFM, m³/h, L/min | Airflow Volume (Q): Indicates the volumetric rate of air displaced per unit of time across the operational fluid channel. |
| Free-Air Delivery Point | Maximum CFM at P = 0 Pa | Far right X-intercept representing unrestricted airflow output without backpressure or duct resistance. |
| Shut-Off / Stall Point | Maximum Pressure at Q = 0 | Top Y-intercept representing a fully blocked exit port. Continuous operation near shut-off risks thermal overload and mechanical wear. |
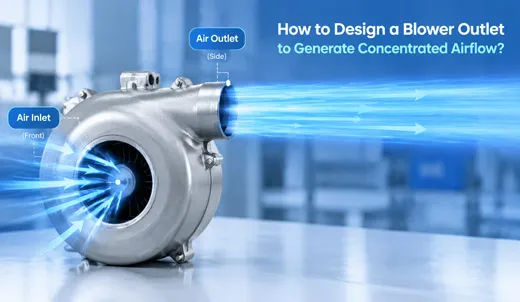
Unlike axial cooling fans—which exhibit a distinct aerodynamic "dip" or stall zone across mid-pressure ranges—a high-efficiency TKFAN air blower relies on centrifugal action. Air enters axially and exits radially at 90 degrees, generating smooth, steep pressure curves capable of penetrating severe system restrictions without instability or turbulence spikes.
Mapping System Impedance and Locating the Real Operating Point
Understanding an individual air blower P-Q curve constitutes only half of the design equation. Every real-world device possesses its own inherent System Impedance Curve (System Resistance Curve). Aerodynamic system resistance follows Fluid Mechanics principles, where static pressure loss (ΔP) scales quadratically relative to volumetric airflow (Q):
ΔP = k × Q²
Here, k represents the system impedance coefficient determined by physical air path geometry. When you overlay the System Impedance Curve onto a validated TKFAN air blower P-Q curve, the point of intersection defines the Actual Operating Point. This intersection represents the exact static pressure and volumetric airflow your assembled device will experience in practice.
Primary Sources of Internal System Resistance:
- Particulate & HEPA Filtration: High-efficiency air filters, antibacterial media, or dust screens (resistance increases over time as dust accumulates).
- Geometric Ductwork: Sharp 90-degree elbows, internal flexible tubing, narrow nozzles, and sudden cross-sectional expansions.
- Component Obstructions: High-density PCBs, heat sinks, cable harnesses, and structural internal ribs.
- Enclosure Venting: Wire grilles, protective mesh covers, and narrow exhaust slots.
Real-World Engineering Case Studies Using TKFAN Air Blower P-Q Curves
1. CPAP & Medical Ventilator System Selection
Medical CPAP systems require precise, pulse-free pressure output to maintain continuous airway pressure. Flexible patient tubing, humidifiers, and inline bacterial filters create significant backpressure. For example, if a medical design requires 12 L/min at 220 Pa static resistance, choosing a standard fan based on a nominal 20 L/min free-air specification fails completely if its curve drops off rapidly under load. Evaluating a specialized TKFAN air blower ensures that the unit delivers the target 12 L/min output precisely at the required 220 Pa operating point while maintaining low acoustic emission levels.
2. Automotive ADAS Sensor Air-Pneumatic Cleaning
Modern Autonomous Driving Assist Systems (ADAS) utilize micro air blowers to fire targeted air jets that clear mud, water droplets, and dust from camera lenses and LiDAR windows. Air jet nozzles exhibit extreme static restriction. OEM engineers rely on the steep high-pressure region of the TKFAN air blower P-Q curve to ensure the selected 12V automotive blower generates adequate burst pressure through small jet apertures.
3. Precision Particle Counter & Air Monitoring Instruments
Dust particle counters require steady sample intake flow across optical measurement chambers. As internal HEPA filters clog, overall system impedance shifts upward. By selecting a high-efficiency TKFAN air blower with a relatively flat mid-range P-Q performance slope, system designers ensure minimal flow variance across filter lifecycles, maintaining precise measurement calibration.
Design Factors Influencing TKFAN Air Blower P-Q Curve Characteristics
Operating Voltage Dynamics
Varying DC input voltage directly scales impeller RPM. Lowering input voltage shifts the entire air blower P-Q curve downward and leftward. Higher voltage translates to elevated static pressure and peak airflow output.
Impeller Geometry Optimizations
Backward-curved impellers provide broad efficiency bands ideal for continuous medical and industrial duty cycles. Forward-curved designs maximize static pressure delivery within ultra-compact spatial footprints.
PWM Speed Control Modulation
Pulse-Width Modulation (PWM) dynamically scales blower performance without altering physical curve geometry. Systems adjust RPM dynamically down a family of parallel P-Q curves to compensate for filter loading.
Step-by-Step OEM Workflow: Selecting an Air Blower via P-Q Curve
- Establish Target Working Conditions: Define required volumetric flow (Q_target), maximum allowable acoustic noise (dBA), operating voltage, physical envelope limits, and IP protection requirements.
- Determine System Resistance (ΔP_loss): Calculate or empirically measure pressure loss across internal ducting and filters at Q_target. Add a 20%–30% safety factor for filter loading and manufacturing tolerances.
- Retrieve Validated TKFAN Curves: Access the full TKFAN air blower catalogue to obtain verified P-Q curve datasets matching your nominal operational voltage.
- Overlay Impedance & Locate Operating Point: Ensure the calculated intersection falls within the high-efficiency mid-section of the air blower P-Q curve, avoiding shut-off zones.
- Validate Auxiliary Parameters: Confirm motor current draw, acoustic output, speed feedback (FG), locked rotor protection (RD), and thermal performance at the operating point.
- Empirical Prototype Testing: Install sample units into working prototypes to empirically confirm airflow and static pressure against datasheet curves.
Custom OEM/ODM Engineering: Modifying P-Q Curves for Unique Demands
When off-the-shelf fan options fail to meet high system impedance targets within spatial limits, custom aerodynamic engineering becomes necessary. TKFAN provides specialized OEM modifications, including tailored blade pitch, customized housing geometry, high-voltage BLDC drivers, custom wiring harnesses, and IP55-IP68 waterproofing upgrades.
Custom engineering projects include complete laboratory wind-tunnel testing and dedicated TKFAN air blower P-Q curve validation reports for full batch consistency.
Technical FAQ: Air Blower P-Q Curve Analysis
Q1: What is an air blower P-Q curve?
An air blower P-Q curve is a performance graph plotting static pressure (P) against volumetric airflow (Q). It illustrates all operational pressure-airflow combinations a blower can provide at a constant voltage and speed.
Q2: Why is free-air CFM insufficient for OEM blower selection?
Free-air CFM reflects zero static pressure resistance. Real-world systems contain filters, heat sinks, and ductwork that create internal friction, causing real airflow to drop below free-air specifications.
Q3: How do I locate the real operating point of a TKFAN air blower?
The operating point is found by plotting the system impedance curve onto the TKFAN air blower P-Q curve. The intersection point defines actual operational airflow and static pressure.
Q4: How does PWM control affect the shape of an air blower P-Q curve?
PWM control changes motor speed, scaling the entire P-Q curve up or down proportionally without altering its baseline geometric profile.
Q5: What happens if an air blower operates continuously near the shut-off point?
Operating near zero airflow causes internal air recirculation, excessive motor heat generation, heightened vibration, elevated acoustic noise, and premature bearing wear.
Q6: Why are centrifugal blowers preferred over axial fans for high-impedance systems?
Centrifugal blowers generate higher static pressure and deliver smooth P-Q performance without the aerodynamic stall regions common to axial fans.
Q7: How does filter dust accumulation impact system impedance?
Dust accumulation increases the system resistance coefficient (k), shifting the impedance curve upward and reducing delivered airflow over time.
Q8: Do voltage variations shift the TKFAN air blower P-Q curve?
Yes. Operating a 24V blower at 18V lowers impeller speed and shifts the entire performance curve to a lower pressure and airflow band.
Q9: What safety margin should be included during blower P-Q selection?
Adding a 20% to 30% static pressure margin compensates for filter loading, component tolerances, and environmental variance.
Q10: Where can I download official TKFAN air blower P-Q curve datasheets?
Official P-Q performance curves and technical specifications are available directly via the TKFAN air blower product catalog.
GET A QUOTE